
Wiki
Wiki
Audio History, Scrubbing & Export
Audio History, Scrubbing & Export
Sonoros records up to five minutes of continuous audio history for every channel while a show is running. You can scrub back through it at any time, export it as a WAV file, and optionally export a PNG of the history chart alongside it.
The history chart
Select any channel from the Monitoring tab. The Channel Info inspector opens at the bottom of the screen, and the history chart is visible.
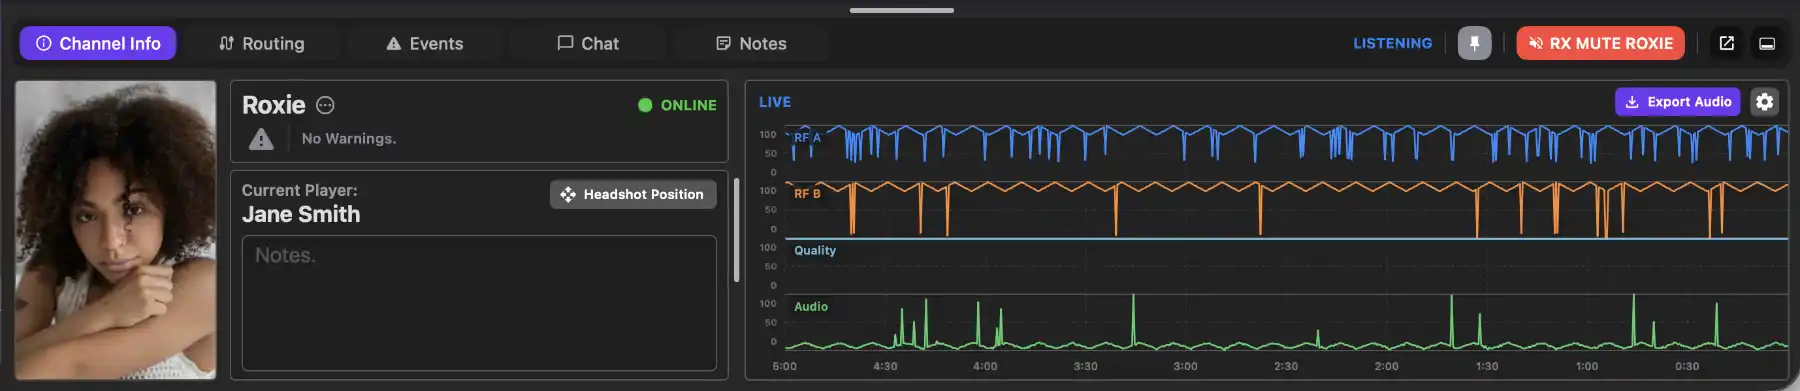
The chart shows up to five minutes of rolling history, scrolling left as time passes. Which data layers appear depends on what the device reports:
RF A / RF B (blue / orange): antenna signal levels from each receiver antenna
Quality (light blue): link quality score
Battery (yellow): transmitter battery level
Audio (green): audio level at the monitoring input
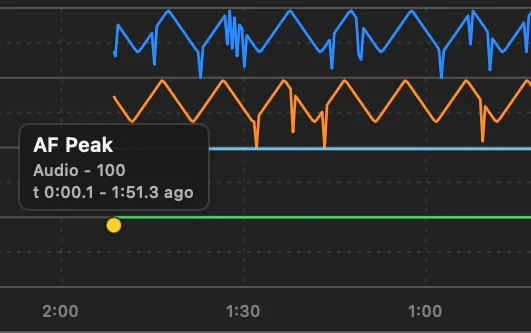
Warning events are marked as small yellow dots on the relevant layer. Hover over one to see the warning type, value, and timestamp.
Scrubbing
Click and drag anywhere in the chart area to scrub back through history. A yellow line marks the current playback position, and the inspector shows PLAYING BACK in the top-left corner while you're in the past.
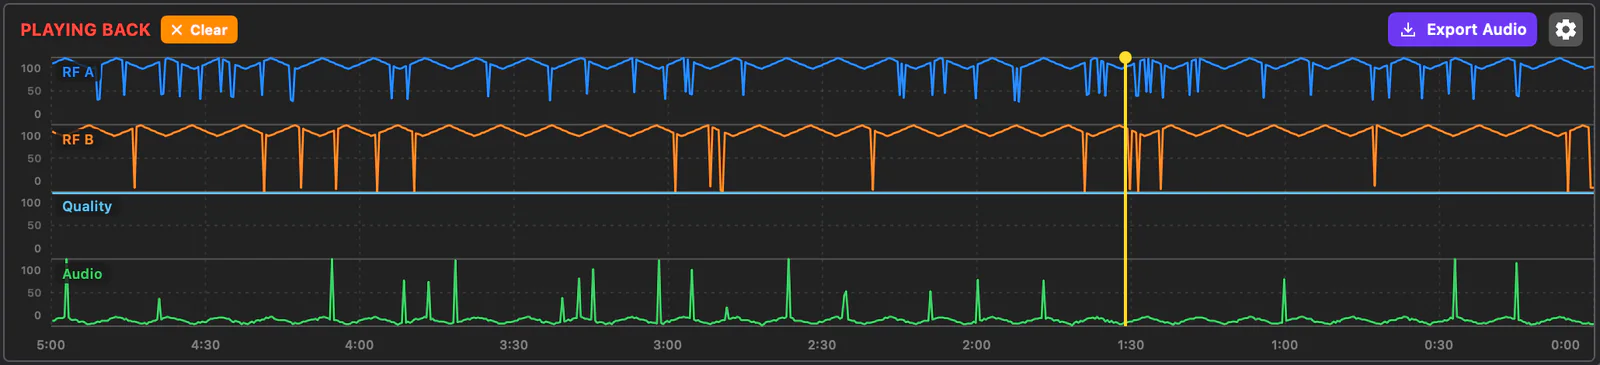
Sonoros plays the audio from whichever point you've scrubbed to. As you drag, the audio follows in real time.
To return to live, click the Clear button or press Esc. The label returns to LIVE and the scrub line disappears.
Chart options
The settings icon in the top-right corner of the chart opens the options menu. The items available depend on what data the selected device reports:
Show Warning Markers: show or hide the yellow warning dots on the chart
Show Battery History: show or hide the battery layer (only appears if the device reports battery data)
Combine RF A+B: merge the two antenna layers into a single combined view (only appears on dual-antenna devices)
Double Height Audio: give the audio layer twice the vertical space of other layers (only appears if the device has both audio and at least one other layer)
If none of these options apply to the current device, the icon is dimmed.

Exporting audio
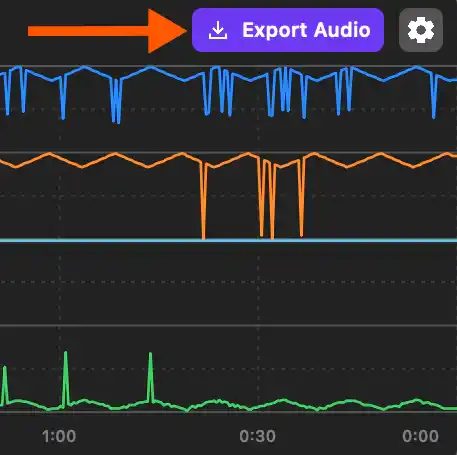
Click Export Audio in the top-right of the chart, or from the main toolbar, to open the export panel.
The panel lists every channel in the show. Tick the channels you want to export. Use Select All or Deselect All to manage the list quickly.
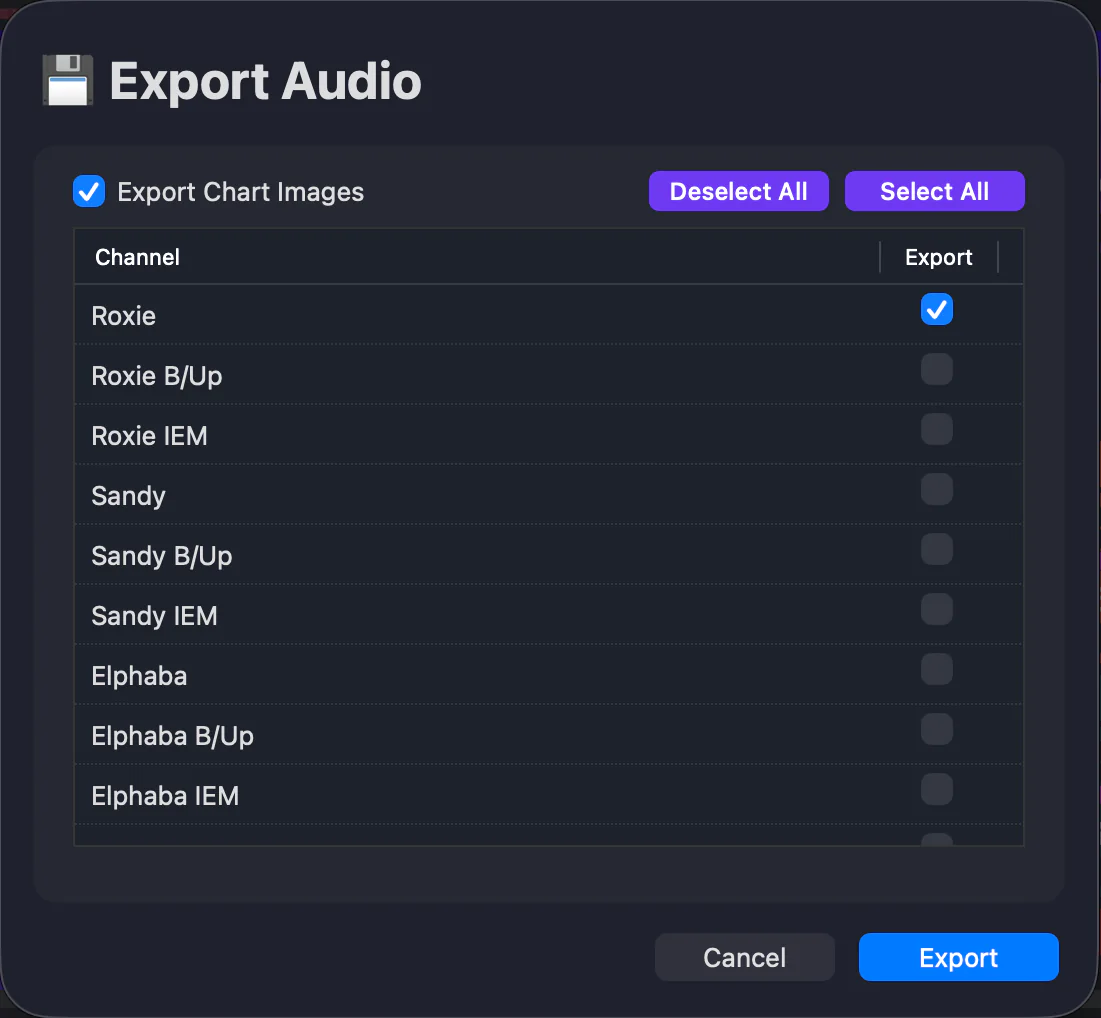
If you want to export a PNG of the history chart alongside each audio file, tick Export Chart Images.
Click Save:
If you've selected one channel, a standard save dialog opens. Name the file and choose a location.
If you've selected multiple channels, a folder picker opens instead. Each channel is saved as a separate file, named after the channel.
Note: Export captures whatever audio was recorded to the history buffer: up to five minutes.
Sonoros records up to five minutes of continuous audio history for every channel while a show is running. You can scrub back through it at any time, export it as a WAV file, and optionally export a PNG of the history chart alongside it.
The history chart
Select any channel from the Monitoring tab. The Channel Info inspector opens at the bottom of the screen, and the history chart is visible.
The chart shows up to five minutes of rolling history, scrolling left as time passes. Which data layers appear depends on what the device reports:
RF A / RF B (blue / orange): antenna signal levels from each receiver antenna
Quality (light blue): link quality score
Battery (yellow): transmitter battery level
Audio (green): audio level at the monitoring input
Warning events are marked as small yellow dots on the relevant layer. Hover over one to see the warning type, value, and timestamp.
Scrubbing
Click and drag anywhere in the chart area to scrub back through history. A yellow line marks the current playback position, and the inspector shows PLAYING BACK in the top-left corner while you're in the past.
Sonoros plays the audio from whichever point you've scrubbed to. As you drag, the audio follows in real time.
To return to live, click the Clear button or press Esc. The label returns to LIVE and the scrub line disappears.
Chart options
The settings icon in the top-right corner of the chart opens the options menu. The items available depend on what data the selected device reports:
Show Warning Markers: show or hide the yellow warning dots on the chart
Show Battery History: show or hide the battery layer (only appears if the device reports battery data)
Combine RF A+B: merge the two antenna layers into a single combined view (only appears on dual-antenna devices)
Double Height Audio: give the audio layer twice the vertical space of other layers (only appears if the device has both audio and at least one other layer)
If none of these options apply to the current device, the icon is dimmed.
Exporting audio
Click Export Audio in the top-right of the chart, or from the main toolbar, to open the export panel.
The panel lists every channel in the show. Tick the channels you want to export. Use Select All or Deselect All to manage the list quickly.
If you want to export a PNG of the history chart alongside each audio file, tick Export Chart Images.
Click Save:
If you've selected one channel, a standard save dialog opens. Name the file and choose a location.
If you've selected multiple channels, a folder picker opens instead. Each channel is saved as a separate file, named after the channel.
Note: Export captures whatever audio was recorded to the history buffer: up to five minutes.